
How Strategic Alignment Unlocks Market Dominance
The story of a three-year PhD, 8,430 companies, and a new concept called Thematic Strategy

The Statistic That Started Everything
Apple consistently achieves around 25% market share of the global smartphone market.
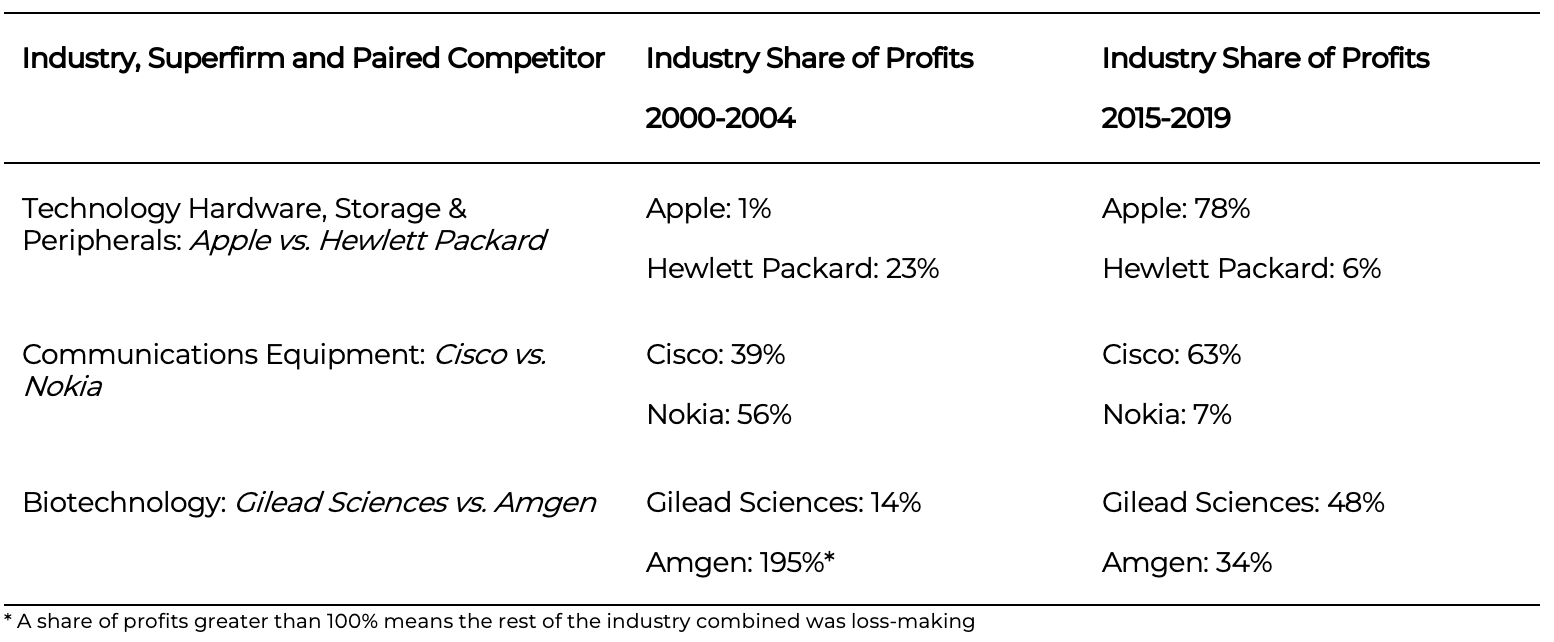
But its profit share? That’s a different story: 78%.
Apple accounts for 78% of all profits generated by the smartphone industry, despite having only a quarter of sales volume. This single statistic changed the way I think about business performance. It told me that the traditional measures of market leadership, whether revenue, unit sales, or market share, miss the point entirely. What matters is not how much you sell, but how much of the value you capture.
That insight became the seed of a three-year PhD research project at ESCP Business School. The question I kept returning to was deceptively simple:
What do companies that dominate their markets actually do differently from everyone else?
Decades of strategic management research have tried to answer this question through different lenses. Strategic foresight says it’s about scanning the environment and anticipating change. The resource-based view says it’s about building unique internal capabilities. Strategic positioning says it’s about finding the right place in the industry structure. Each offers part of the answer. None offers the whole picture.
Then I came across a paper from 1993 by Igor Ansoff and Patrick Sullivan that reframed the question entirely. Their argument was straightforward: there is no single success formula with universal validity. The profitability of a firm is optimised when its strategic behaviour is aligned with its environment.
This is the concept of the environment-driven firm. It doesn’t assume markets will keep growing. It continually monitors the external world for signs of demand saturation, technology substitution, social and political discontinuities. It assesses the future profitability and growth potential of its historic markets. It searches for new opportunities while divesting from unpromising ones. Most importantly, it treats the external environment as a moving reference point — a feedback loop that strategy must constantly adapt to.
What matters is not how strategy is derived, but how well it stays aligned with environmental realities over time.
This concept led me to structure my entire PhD around a single proposition:
Companies that align their strategies with external drivers of transformation can achieve market dominance.
Intuitively, it felt right. But I needed to prove it.
Three Papers, One Argument
To investigate this proposition, I needed to answer two questions in sequence before I could test anything.
First, what does market dominance actually mean, and how can it be measured? If I’m going to claim that certain firms achieve dominance, I need to define the term rigorously and identify which companies meet the threshold.
Second, what are the external drivers of transformation that firms are expected to align with? If alignment is the mechanism, I need a structured way to describe what firms are aligning with.
Only once those two foundations were in place could I test the central proposition: does strategic alignment with external drivers of transformation actually distinguish dominant firms from their peers?

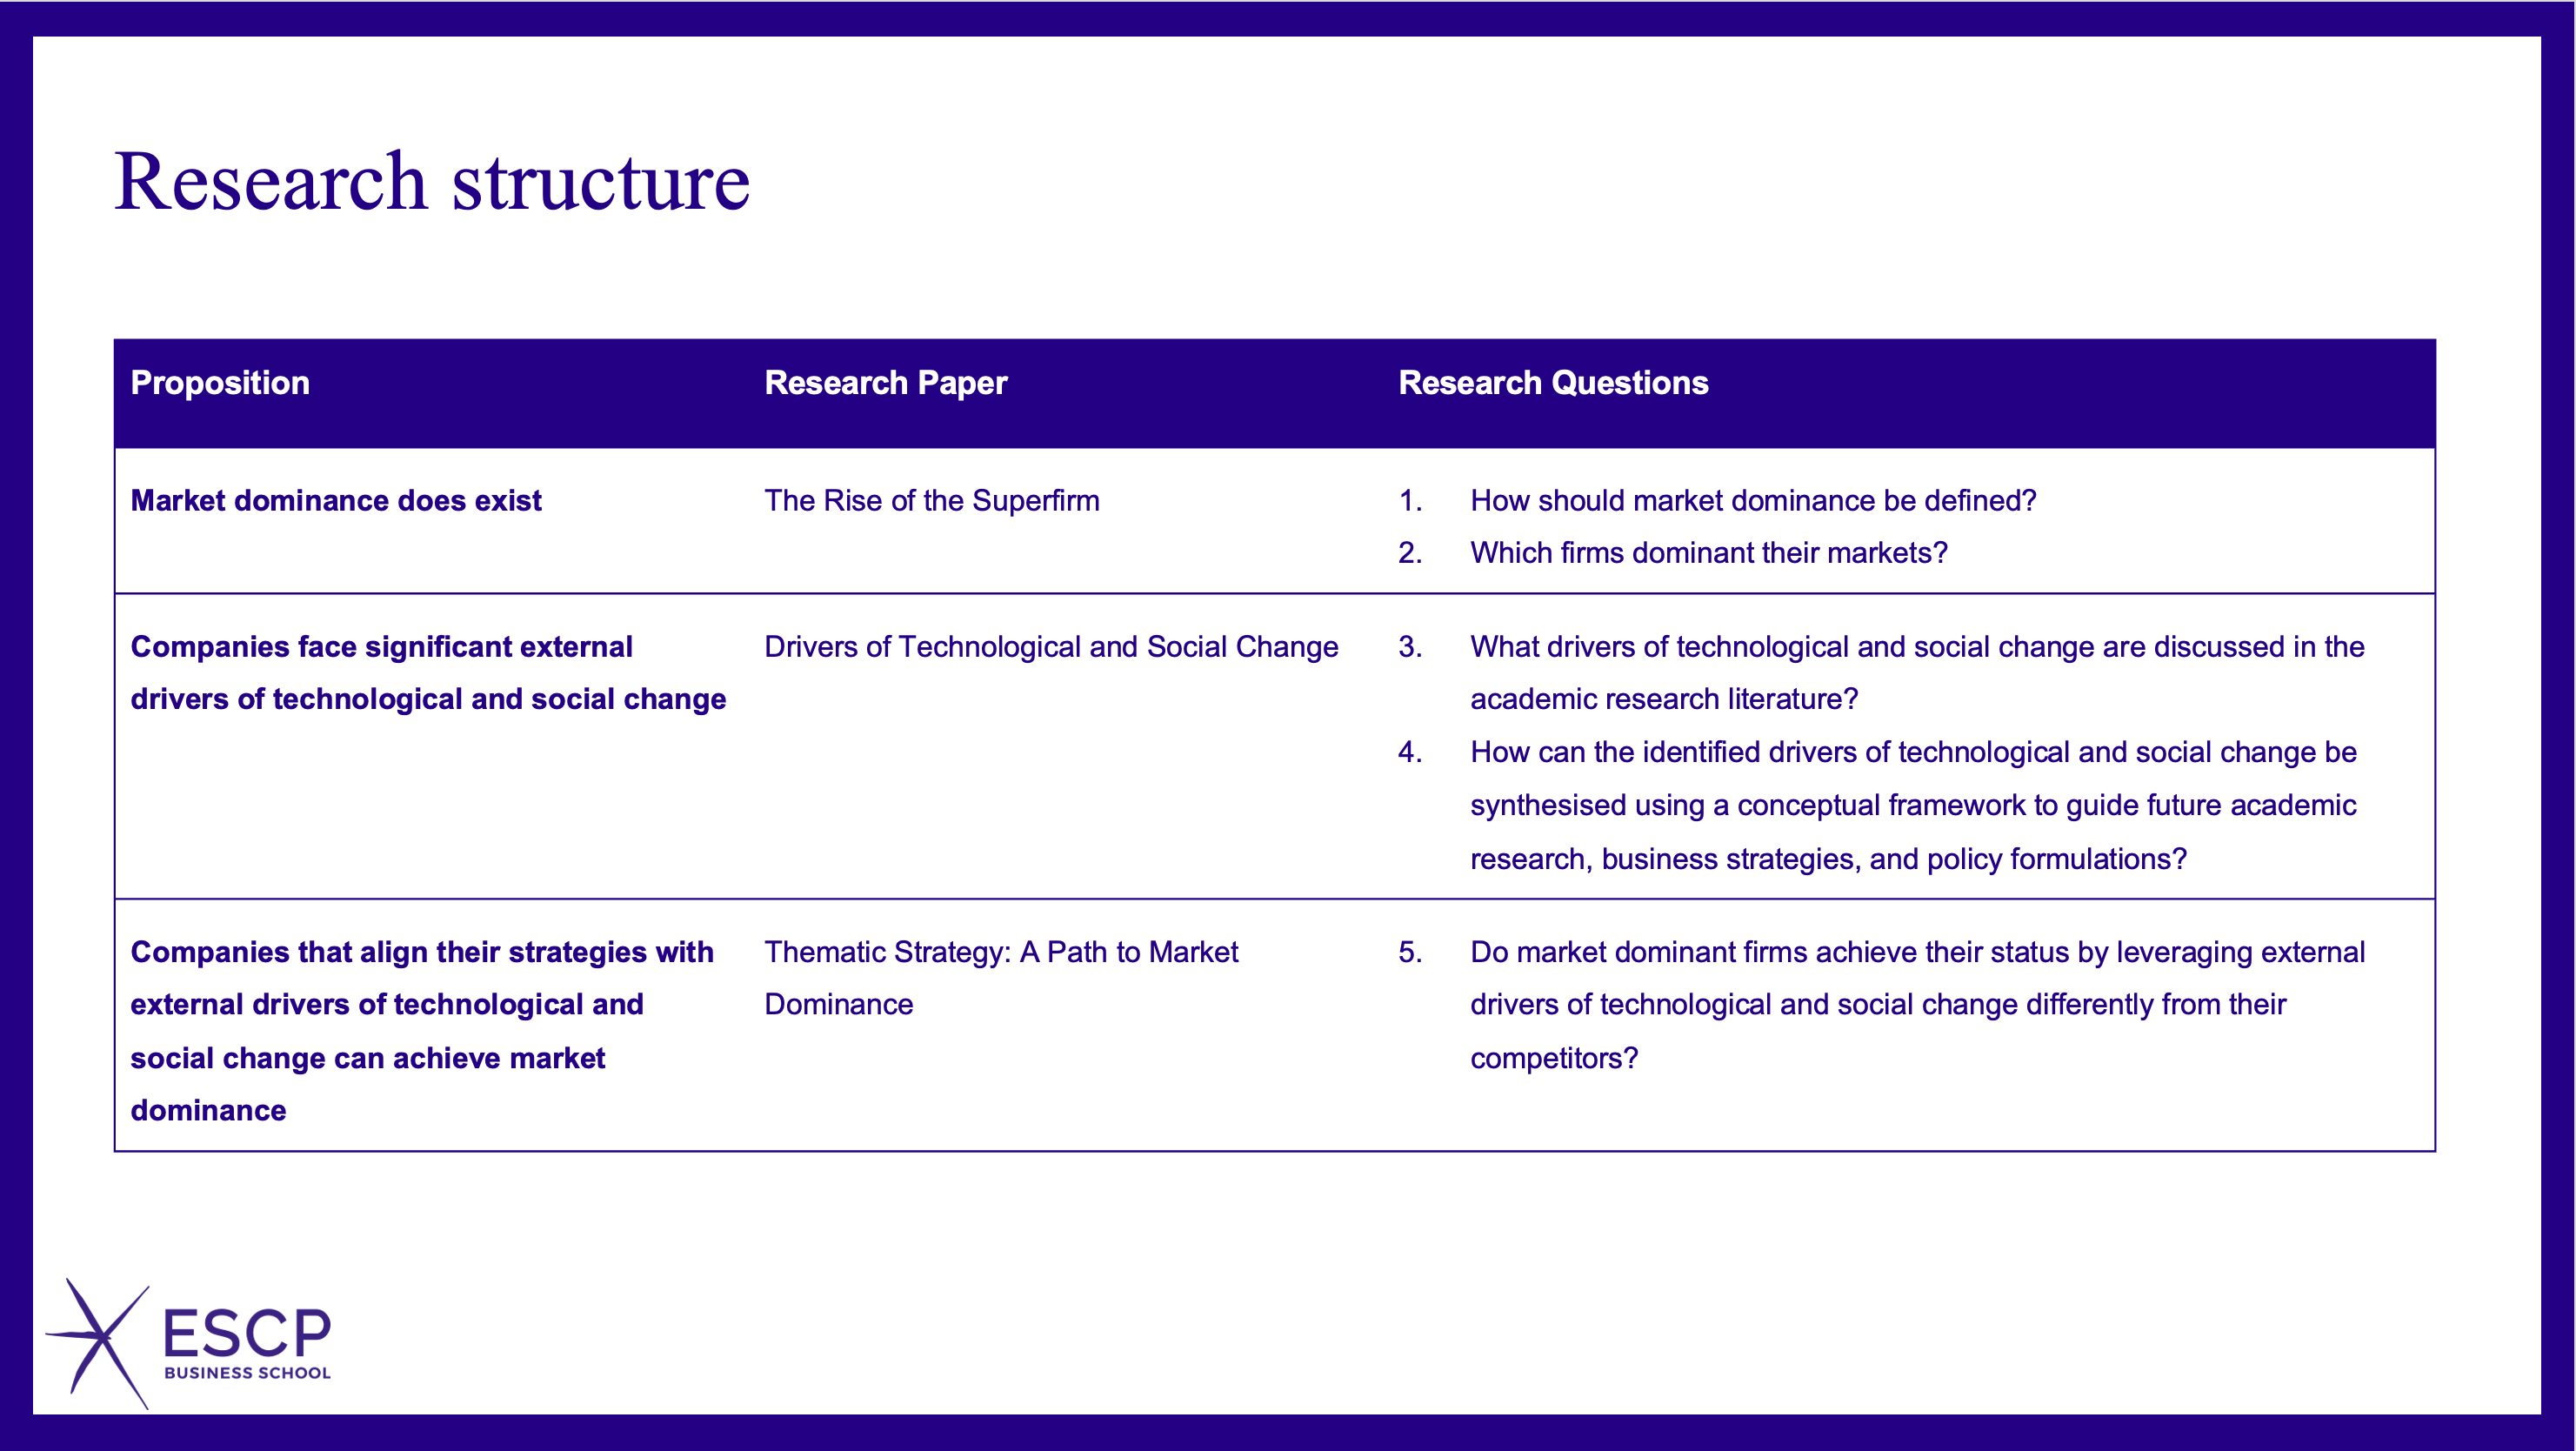
I structured the research across three papers, each building on the last:
Paper 1: The Rise of the Superfirm. Defined market dominance, created a formula to measure it, and identified the firms that met the threshold.
Paper 2: Drivers of Transformation. Conducted a systematic literature review spanning four decades to map the complete landscape of external forces reshaping how firms compete.
Paper 3: Thematic Strategy — A Path to Market Dominance. Combined the prior insights by analysing 20 years of annual reports from six firms to test whether strategic alignment with external drivers distinguishes dominant firms from their competitors.
Each paper took roughly a year to complete. Each processed vast amounts of data. Together, they built a cumulative argument with each paper providing a necessary foundation for the next. Without a rigorous definition of dominance, I couldn’t identify which firms to study. Without a comprehensive framework of drivers, I couldn’t test alignment. Without the test, the proposition would remain an intuition rather than an evidence-based idea.
The Rise of the Superfirm
The first paper had a clear objective: define market dominance and find out whether it exists.
I started by rejecting the traditional measures. Revenue, sales volume, and unit market share; these tell you who sells the most, not who captures the most value. Over the long term, profit drives shareholder value. And shareholder value is what executive teams are ultimately rewarded for creating. So I defined market dominance as having a dominant share of an industry’s profit pool.
That raised a harder question: at what point does a company’s profit share become “dominant”? The threshold needs to be empirically grounded and applicable to any market. After extensive research, I found the answer in an unexpected place: antitrust law.
In 2008, Arie Melnik and colleagues published a formula for calculating the market share threshold at which dominance exists:
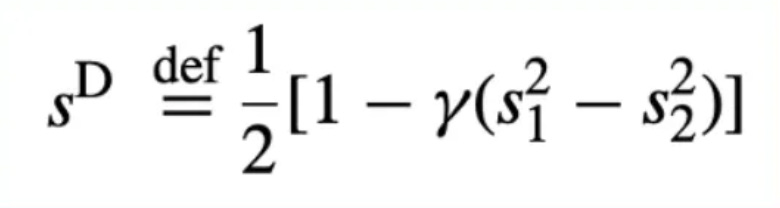
The formula compares the largest company in an industry with the second-largest. The key insight is that dominance increases as the gap between first and second widens. The formula produces a threshold that’s specific to each industry, so there’s no arbitrary fixed number.
I used GICS industries as ‘the market’ because the classification narrows companies to similar business activities. Companies within each industry are directly comparable, as they sell similar products and services and compete for similar customers. You could define industry differently, but the principle holds: it needs to represent a group of similar firms in genuine competition.
I applied this formula to the profit shares of companies across 81 GICS industries. The dataset covered 8,430 US-listed companies, and I used a five-year profit pool from 2015 to 2019 to avoid distortions from COVID and the 2008 financial crisis. Industries with fewer than ten companies were excluded to avoid structurally concentrated markets; I was looking for dominance earned through competition, not dominance by default.
Take Apple as an example. In that period, Apple’s share of profits in the Technology Hardware, Storage & Peripherals industry was 82%. The second-largest was Dell at 4%. Applying the dominance formula, the threshold for that industry came out at just 16%. Apple surpassed it by a wide margin.
Of the 8,430 companies analysed, just 11 met the conditions for market dominance. I called them Superfirms.
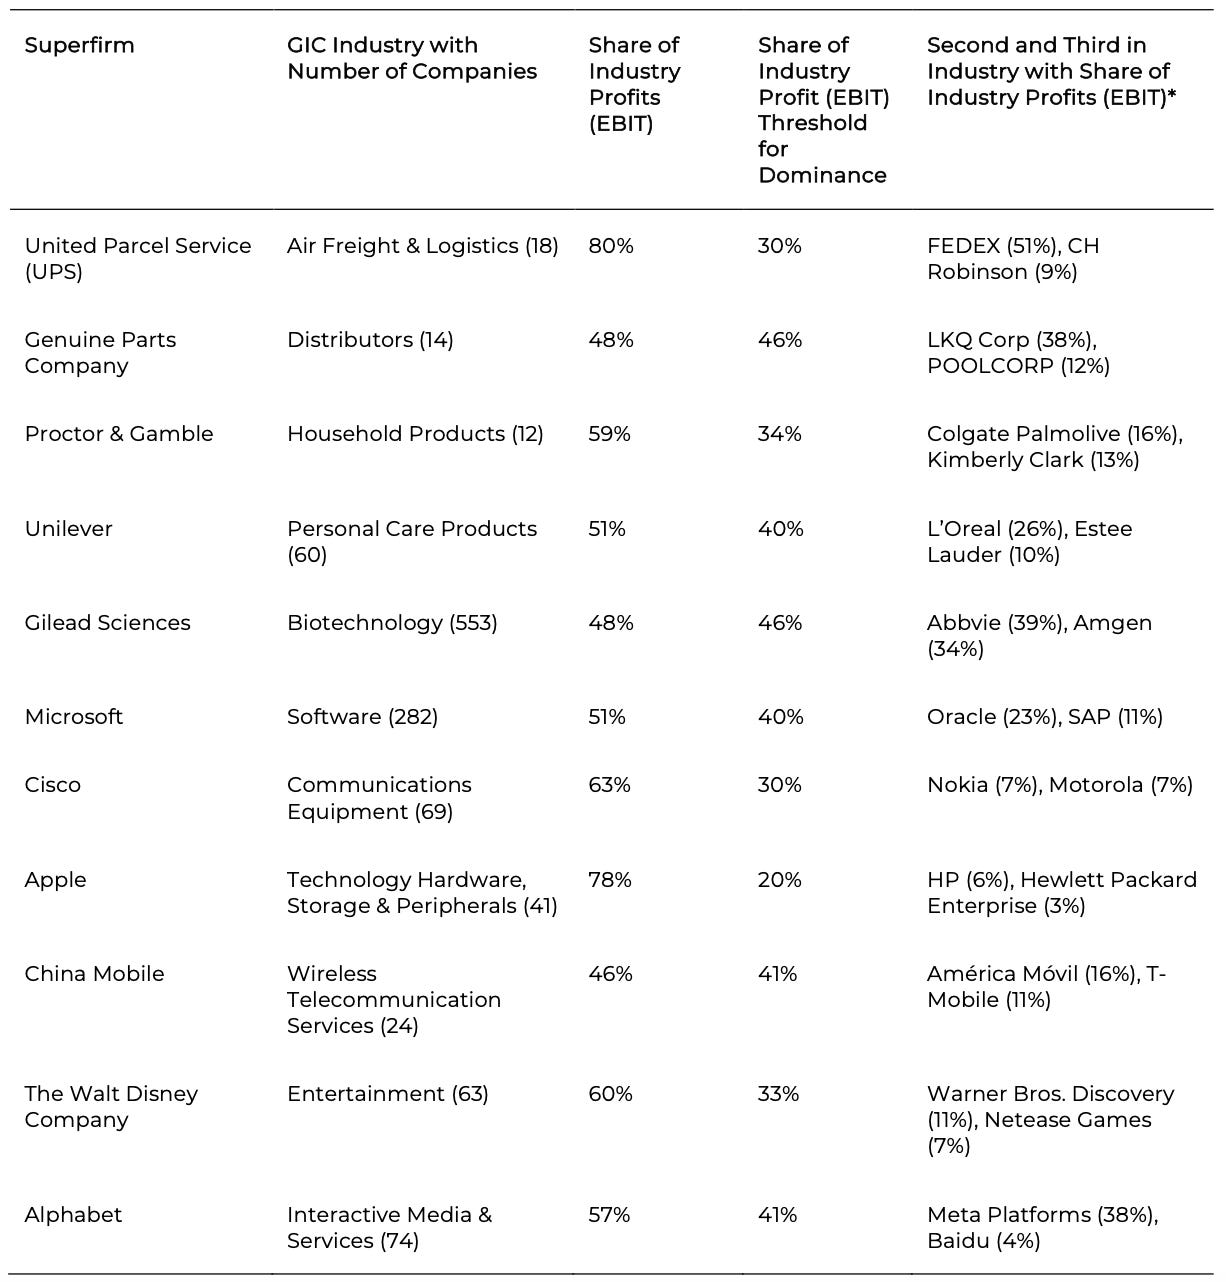
This was good news on two fronts. Market dominance exists. And it is extraordinarily rare.
With hindsight, this finding was fortunate. I had a notion of market dominance. I found a rigorous formula to test it. The result was a small, identifiable group of firms I could study further.
But identifying the Superfirms was only the beginning. The next question was how they achieved it. I developed four sequential propositions to frame the argument:
Proposition 1: Superfirm status requires a distinct competitive advantage that sets a company apart from its competitors.
Proposition 2: External drivers of transformation define and redefine competitive landscapes and alter the parameters of competitive advantage.
Proposition 3: Companies that align their strategy with external drivers of transformation are better positioned to proactively adapt and innovate, sustaining and enhancing their competitive advantage.
Proposition 4: Sustaining and enhancing competitive advantage leads companies towards Superfirm status.
The logic flows in sequence. You need a distinctive advantage. That advantage exists within an environment shaped by external forces. The firms that align with those forces can adapt and innovate. And that sustained adaptation is what leads to dominance.
But I couldn’t just state this as true. I had to prove it. And to prove it, I first needed to understand what those external drivers of transformation actually are.
Mapping the Forces of Transformation
I assumed a clear, widely accepted framework of external drivers of transformation already existed.
It didn’t.
Instead, the literature is fragmented. Terms like megatrends, disruptive innovation, creative destruction, and paradigm shifts are used inconsistently and often interchangeably. They point to real phenomena, but they lack shared definitions, a common unit of analysis, and an agreed structure.
This creates three problems. Conceptual ambiguity, where distinct forces get blurred together under loose labels. Analytical weakness, where drivers are studied in isolation without a framework showing how they relate to one another. And strategic failure, where leaders struggle to translate abstract change into concrete strategic choices.
The root cause is straightforward: there is no commonly used driver construct and no comprehensive framework spanning both concrete forces and more abstract systemic change.
That gap became the focus of my second research paper, and the most demanding part of my PhD. Where the first paper was quantitative and structured (data in, formula applied, results out), the second paper required me to read, absorb, and synthesise an enormous body of qualitative research across significantly different disciplines.
I used a systematic review of the global research literature to identify every driver of transformation discussed across economics, technology, policy, medicine, the environment, geopolitics, and social change. I built a precise search logic using a wide set of phrases that capture how transformation is described across different fields. I set strict selection rules: peer-reviewed work only, any time period, English language, and only articles where external change was the central focus.
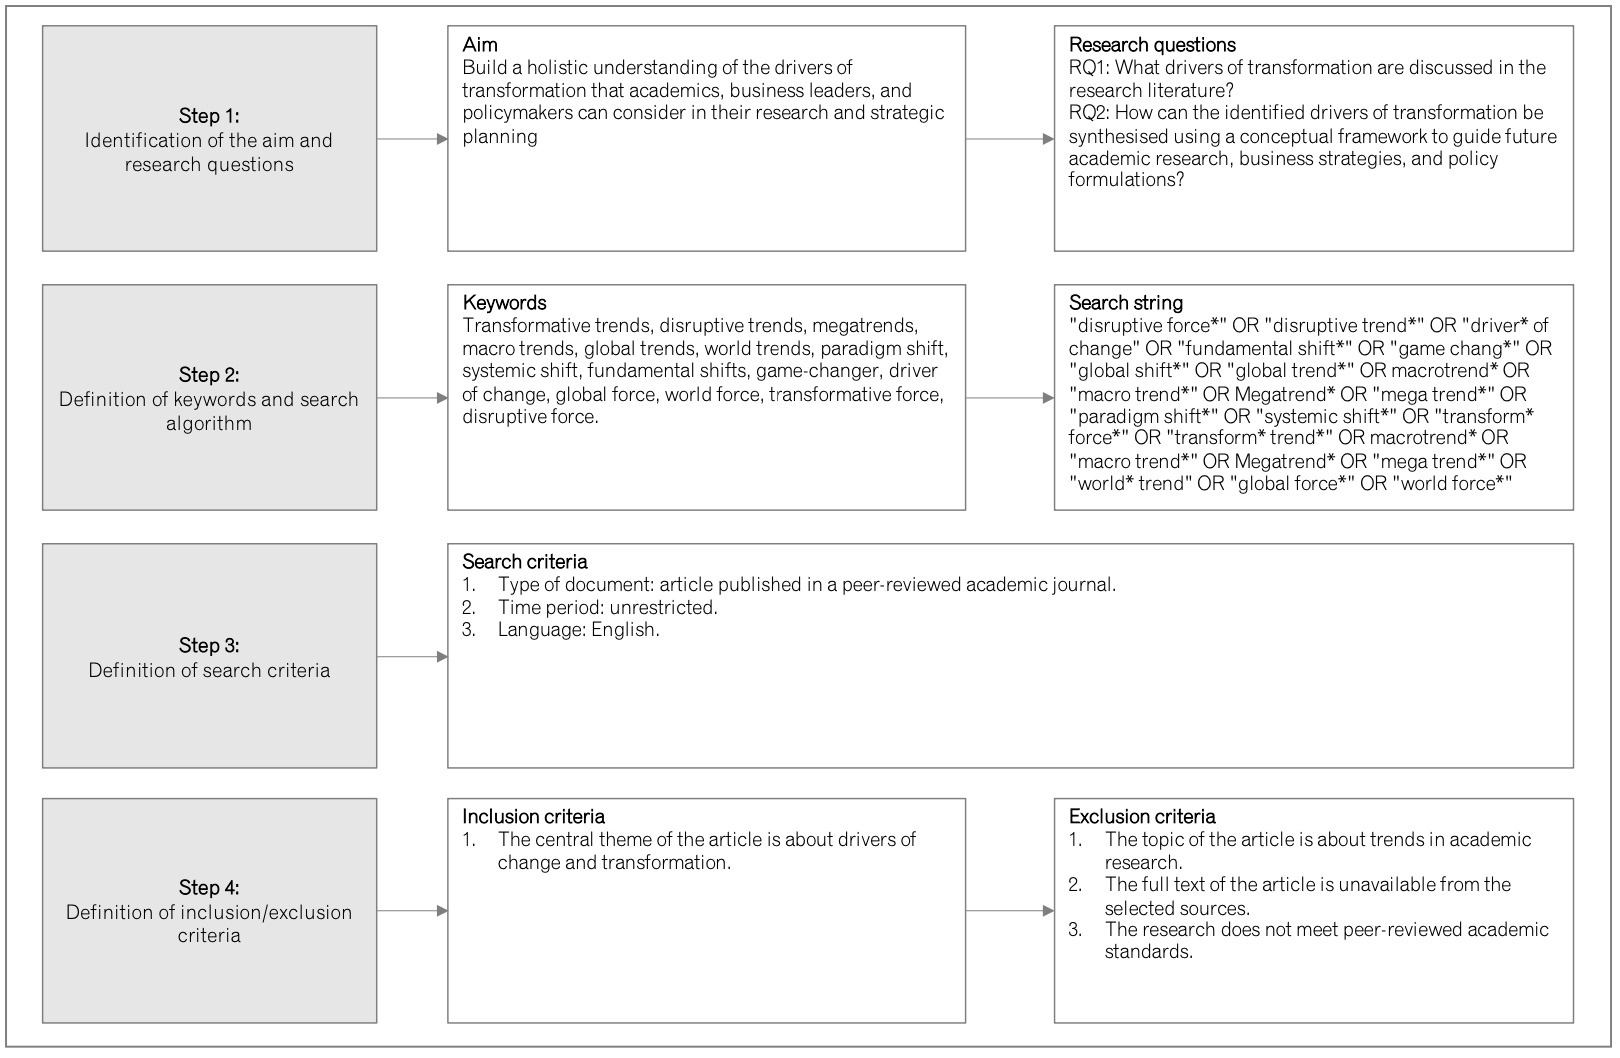
I applied this process across two major research databases, Web of Science and EBSCO. The result was 1,234 serious research papers. More than 10 million words.
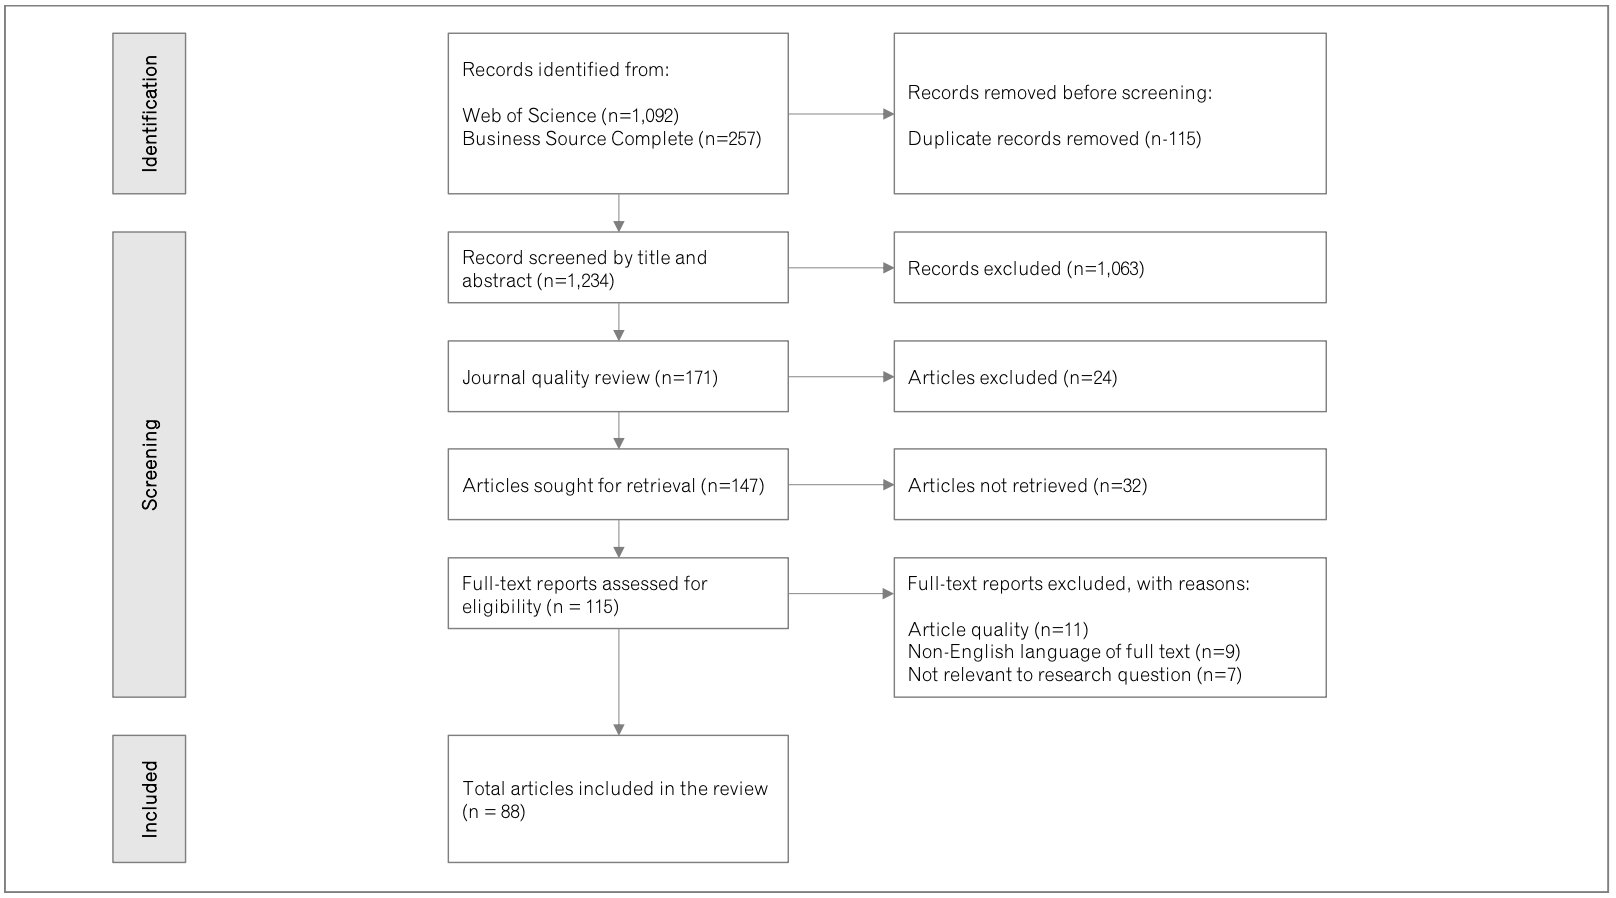
I read all 1,234 abstracts and assessed whether each paper was genuinely about drivers of transformation. Five minutes per abstract. Over 100 hours. Spread across four months, before work and at weekends. I have a mild form of dyslexia, which made the academic language especially hard going. That reduced the set to 171 papers. After filtering for journal quality and full-text access, and reading the remaining articles in full, I arrived at a core set of 88 papers representing the serious body of work on this topic.
I then used descriptive coding techniques to extract signal from noise. This requires reading every sentence carefully and, where it’s relevant to the research question, capturing a word or short phrase that assigns a summative attribute to it. The result was thousands of captured codes, from which I distilled 292 distinct drivers of transformation.
Interestingly, after about 60 articles, I had exhausted the findings. The remaining papers reinforced and refined what was already present but added no new drivers. That’s a strong signal that the review was comprehensive.
Now I had my answer to the first research question: what drivers of transformation are discussed in the academic literature? The harder question remained: how should these 292 drivers be organised into something leaders, researchers, and policymakers can actually use?
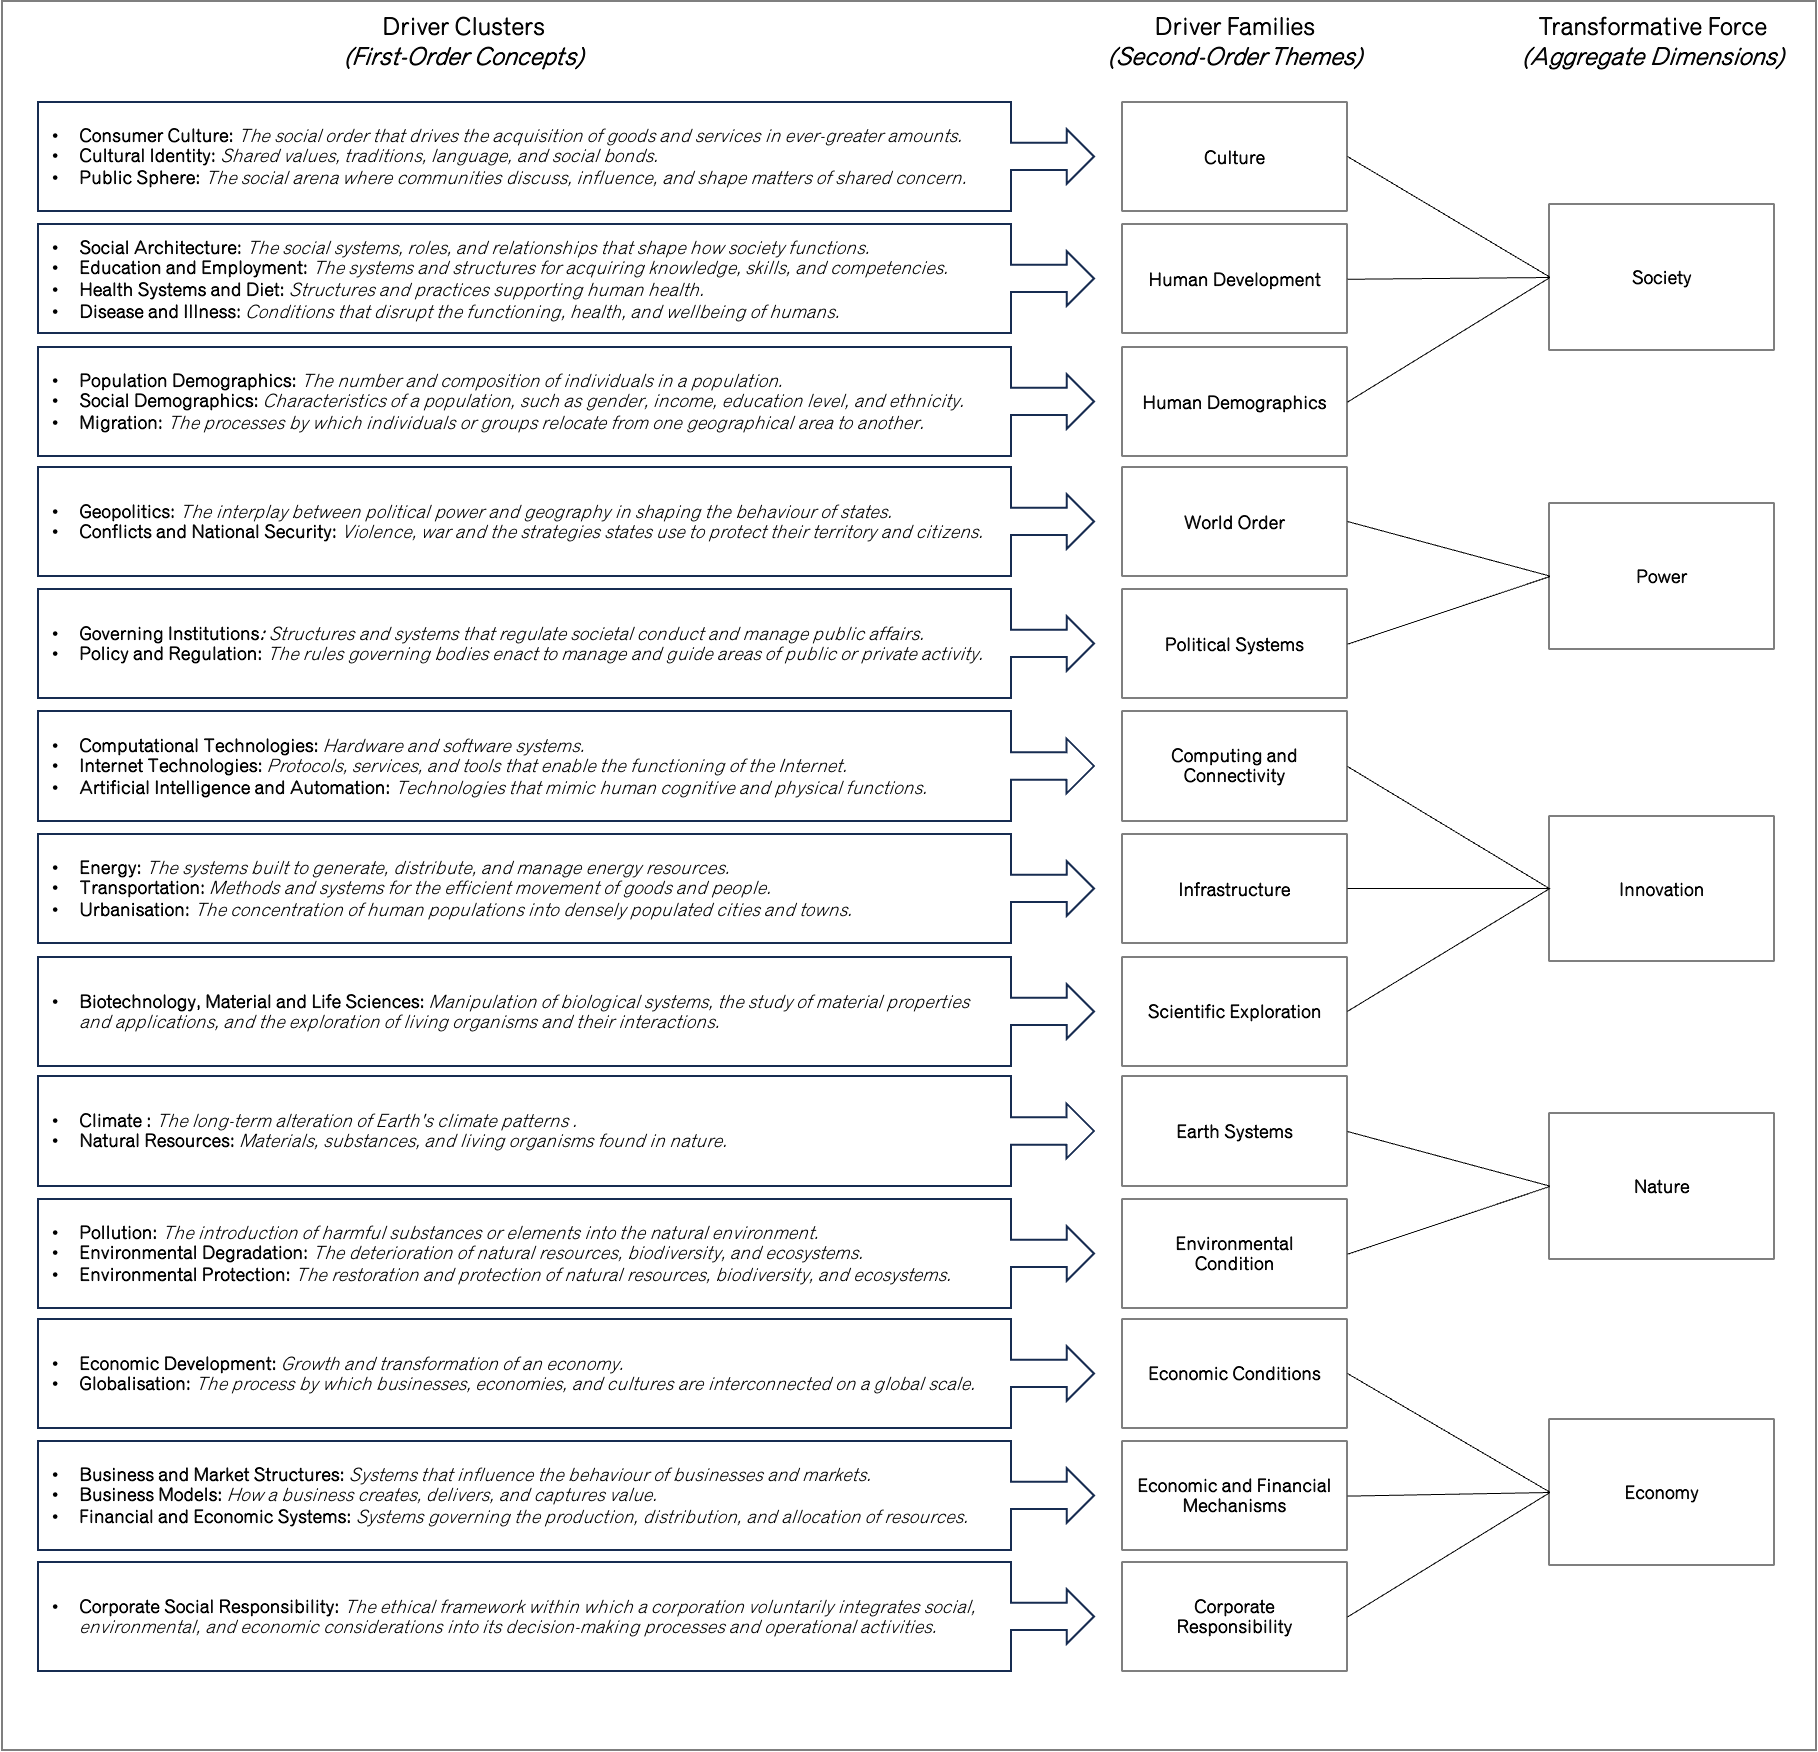
I organised the evidence into four analytical levels:
292 Drivers of Transformation. A driver affects humans and their environment. It can be concrete — electric vehicles, extreme weather, pollutants — or abstract: a pandemic, political ideology, the internet.
32 Driver Clusters. Related drivers that shape the same area of change are grouped together. Machine learning and autonomous vehicles sit within artificial intelligence and automation. Global warming and extreme weather are part of climate change.
13 Driver Families. Clusters operating in the same broad domain are grouped again. Artificial intelligence and internet technologies fall within computing and connectivity. Pollution and environmental degradation fall within environmental conditions.
5 Transformative Forces. At the highest level, the driver families aggregate into five fundamental forces shaping long-term transformation: Society, Power, Innovation, Nature, and Economy. Together, these form the SPINE framework.
Society captures the broad forces that shape how humans collectively live and interact: population demographics, urbanisation, consumer culture, health and wellbeing.
Power encompasses the forces that govern how authority and influence are distributed: geopolitics, governance, policy and regulation, conflict.
Innovation covers the forces driving technological and scientific progress: computing, connectivity, artificial intelligence, biotechnology, new materials.
Nature addresses the forces arising from the physical environment: climate change, pollution, resource depletion, biodiversity.
Economy captures the forces shaping how value is created and exchanged: globalisation, trade, financial systems, business models.
I also conducted a sentiment analysis and a literature growth analysis. For each driver cluster, I assessed whether academic discourse framed its impact as positive, negative, or both. And I calculated the compound annual growth rate of publications for each cluster as a proxy for rising importance.
Combining these two signals produced the Growth-Impact Matrix: a 4x4 framework mapping driver clusters according to how fast they’re growing and whether their impact is positive or negative. The growth axis runs from baseline to exponential, reflecting how rapidly research attention is increasing. The impact axis runs from threat to opportunity, reflecting whether the academic discourse frames the driver’s effects as harmful or beneficial. This provides leaders with a way to identify which drivers are accelerating and whether they represent opportunities to pursue or threats to manage.

With this in place, I had two core inputs for testing the central proposition of my PhD: a definition and measure of market dominance, and a structured framework of the external drivers of transformation. The final paper brought them together.
Testing It: Twenty Years of Annual Reports
The third paper was the test. Do Superfirms align their strategies with external drivers of transformation more extensively than their direct competitors?
I needed a data source that would reveal strategic intent over a sustained period, be comparable across firms, and be publicly available. Annual reports (10-K and 20-F filings) met all three criteria. These documents require management to disclose strategic and operational information affecting the company’s performance and outlook. They’re rich in narrative about where the company is heading and why.
The design was built around matched pairs. I selected three Superfirms and paired each with a competitor from the same GICS industry that had held the leading share of industry profits during 2000 to 2004 but subsequently lost that position to the Superfirm. This gave me a direct comparison: two firms facing the same market conditions, the same competitive pressures, and the same external forces, but with very different outcomes over the following fifteen years.
Crucially, comparison companies were in the same GICS industry. This ensured they shared similar core activities, served comparable customer bases, faced the same macroeconomic trends and regulations, and competed for similar resources. Any difference in strategic narrative would therefore reflect genuine strategic choices, not structural differences in business context.
The three pairings were Apple vs Hewlett-Packard (HP), Cisco vs Nokia, and Gilead Sciences vs Amgen.
For each company, I analysed annual reports from 2000 to 2019, twenty years and 120 reports in total. The total text across all reports was 9.1 million words.
I used dictionary-based content analysis. For each of the 32 driver clusters in the SPINE framework, I created a dictionary of keywords derived from the full word list across all 120 reports. After extensive filtering (removing infrequent words, mapping relevant terms to each driver cluster, and deduplicating), I arrived at 419 single words and 35 two-word phrases distributed across 23 active dictionaries.
Using the software package MAXQDA, I coded every report against every dictionary and measured the density of each driver cluster in each company’s narrative expressed as the percentage of total words that matched each dictionary.
The analysis then proceeded in three stages. First, I calculated the average density for each company to identify which driver clusters each firm emphasised. Second, I ran independent two-tailed t-tests to establish whether differences between paired firms were statistically significant. Third, I classified each driver cluster by its importance in the text: not important, average, elevated, or significant.
This gave me a rigorous, quantitative basis for answering whether a Superfirm’s strategic narrative was measurably different from its competitor’s.
What the Data Revealed
Apple vs HP
In the early 2000s, both Apple and HP were established players in personal computing. Apple centred on design and software innovation with the Mac, which was renowned for its user experience but held a minority share of the PC market. HP was a dominant force in printers, enterprise hardware, and computing infrastructure, with a vast installed base of corporate customers and one of the strongest brands in technology.
Over the next two decades, their trajectories diverged dramatically. Apple launched the iPod, then the iPhone, then the iPad, reinventing consumer technology category by category. HP went through a series of leadership changes, a contested merger with Compaq, and struggled to define a coherent strategic direction beyond its legacy enterprise business.
The content analysis told a clear story of divergence. Across the 23 driver clusters, Apple and HP each placed a greater emphasis on eight, with a similar emphasis on seven.
Apple placed computational technologies at a level of significant importance — 1.06% of all words in its annual reports belonged to this driver cluster, far above HP’s 0.56%. Apple also placed significantly greater emphasis on consumer culture and globalisation. These three themes tell us something important: Apple oriented its entire strategic narrative around technology-led consumer innovation on a global scale.
HP, by contrast, placed significant emphasis on business markets and structures (1.37% vs Apple’s 0.98%), reflecting its deeper orientation toward enterprise operations, corporate clients, and operational infrastructure. HP also emphasised education and employment more than Apple.
The distinction is stark. Apple looked outward to the consumer and the world. HP looked inward to the enterprise.

Significant difference measured using a t-test where * is a p-value lower than 0.05 and ** is a p-value lower than 0.01.
Cisco vs Nokia
During the early 2000s, Cisco and Nokia were both leaders in global communications. Though they operated in adjacent segments: Cisco in networking infrastructure powering the internet backbone, Nokia in mobile handsets and telecom equipment, both were classified within the same GICS industry, and both provided the foundational technology for how the world communicated.
By the end of the period studied, Cisco had cemented its position as the dominant provider of enterprise networking, expanding into security, collaboration tools, and cloud infrastructure. Nokia, once the world’s largest mobile phone manufacturer, had lost its handset business to Apple and Samsung and had pivoted to become a telecom equipment provider, a fundamentally different and smaller business.
Across the 23 driver clusters, Cisco placed greater emphasis on six, Nokia on ten, with seven similar between them.
Cisco’s most significant emphasis was on business models — 4.16% of all words, far above Nokia’s 3.22%. Cisco also placed significantly greater emphasis on business markets and structures, and consumer culture. These themes reveal Cisco’s strategic focus on how products and services were delivered, how markets were structured, and how customer needs were evolving.
Nokia, by contrast, emphasised financial and economic systems (1.26% vs Cisco’s 0.56%) and education and employment. Nokia’s narrative was weighted toward financial management and workforce considerations rather than market-facing innovation.
Cisco oriented toward the environment. Nokia oriented toward its own financial and organisational mechanics.
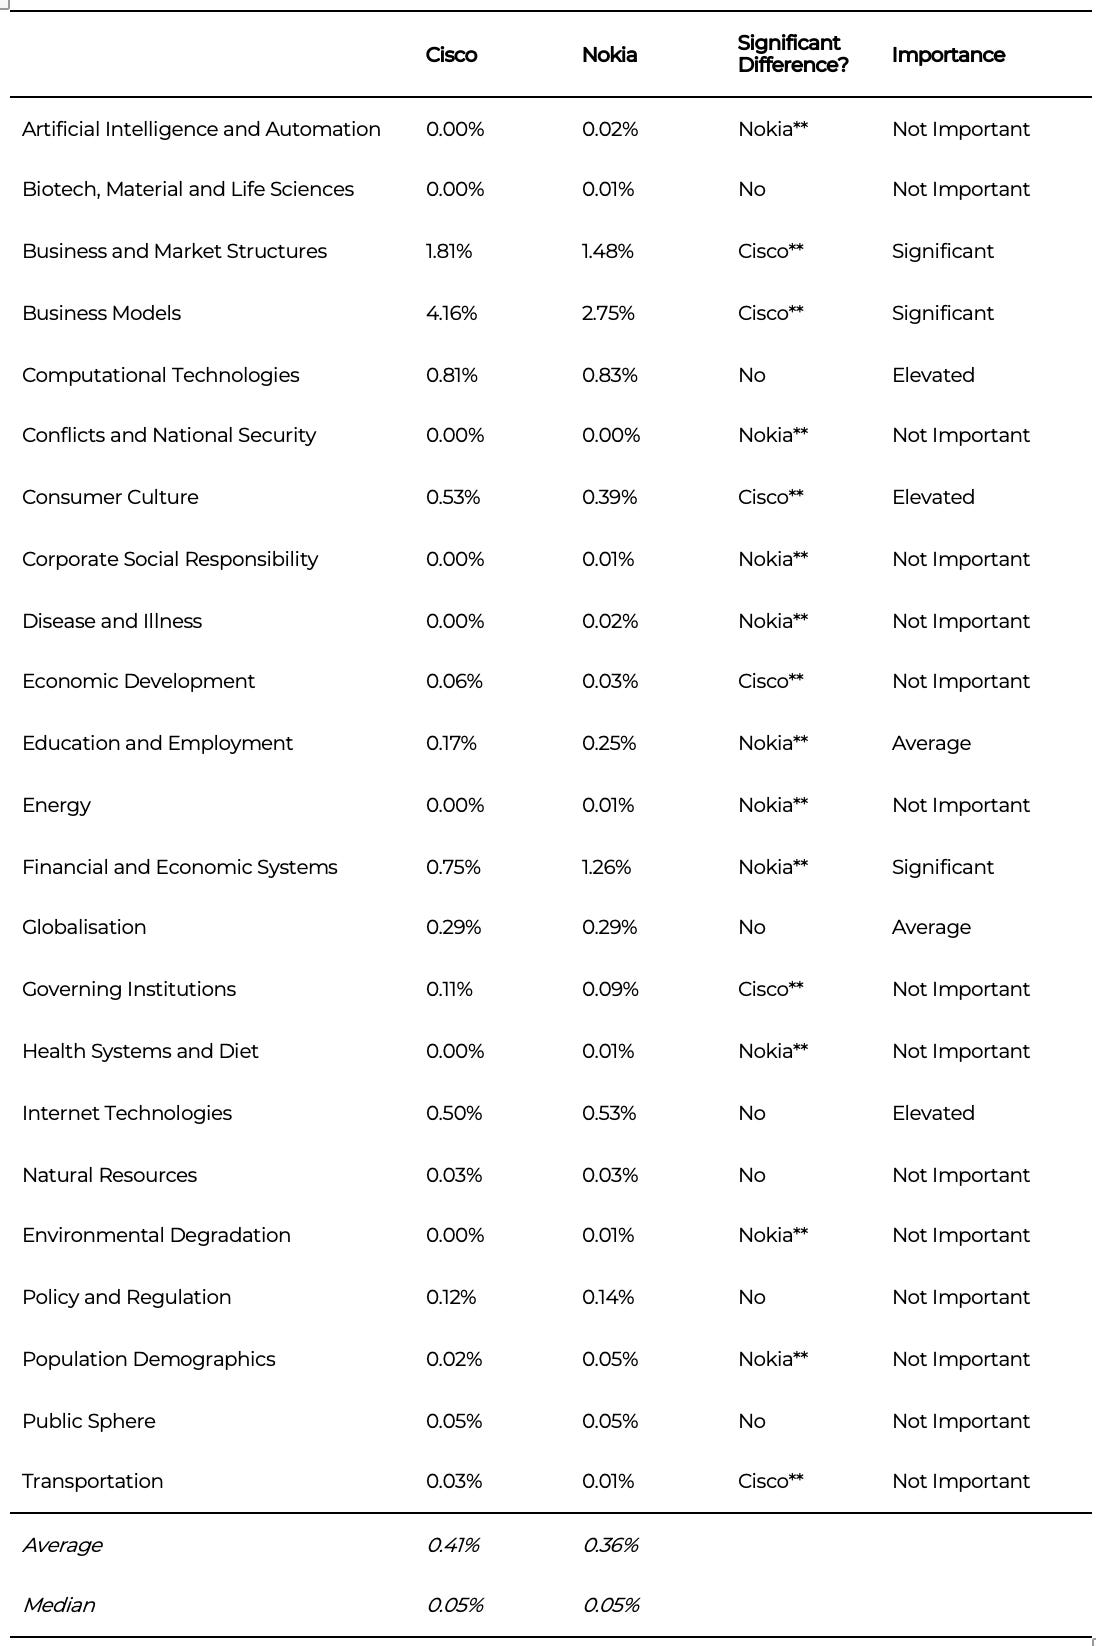
Significant difference measured using a t-test where * is a p-value lower than 0.05 and ** is a p-value lower than 0.01.
Gilead Sciences vs Amgen
In the early 2000s, both Gilead and Amgen were well-established biotech firms. Gilead was growing rapidly through its specialisation in antiviral treatments for HIV and hepatitis. Amgen was a leader in oncology and nephrology, widely regarded at the time as the dominant firm in the space — Fortune magazine once called it a “new colossus” of biotech.
Over the next two decades, Gilead expanded aggressively into global markets, built a blockbuster portfolio of antiviral drugs, and ultimately achieved a dominant share of its industry’s profits. Amgen remained a significant player but never captured the same level of profit dominance, despite its strong scientific capabilities and large product portfolio.
Across the 23 driver clusters, each firm placed greater emphasis on six, with eleven similar between them.
Gilead’s significant emphases were on business models (3.22%) and business markets and structures (1.31%). It also placed significantly greater emphasis on computational technologies and globalisation. Like Apple and Cisco, Gilead oriented outward: toward market expansion, technology adoption, and the evolution of how its products reached patients globally.
Amgen emphasised financial and economic systems (0.88%) and policy and regulation (0.31%) significantly more than Gilead. Amgen’s narrative was anchored in regulatory compliance and financial management.
The same pattern emerged. The Superfirm looked outward. The competitor looked inward.
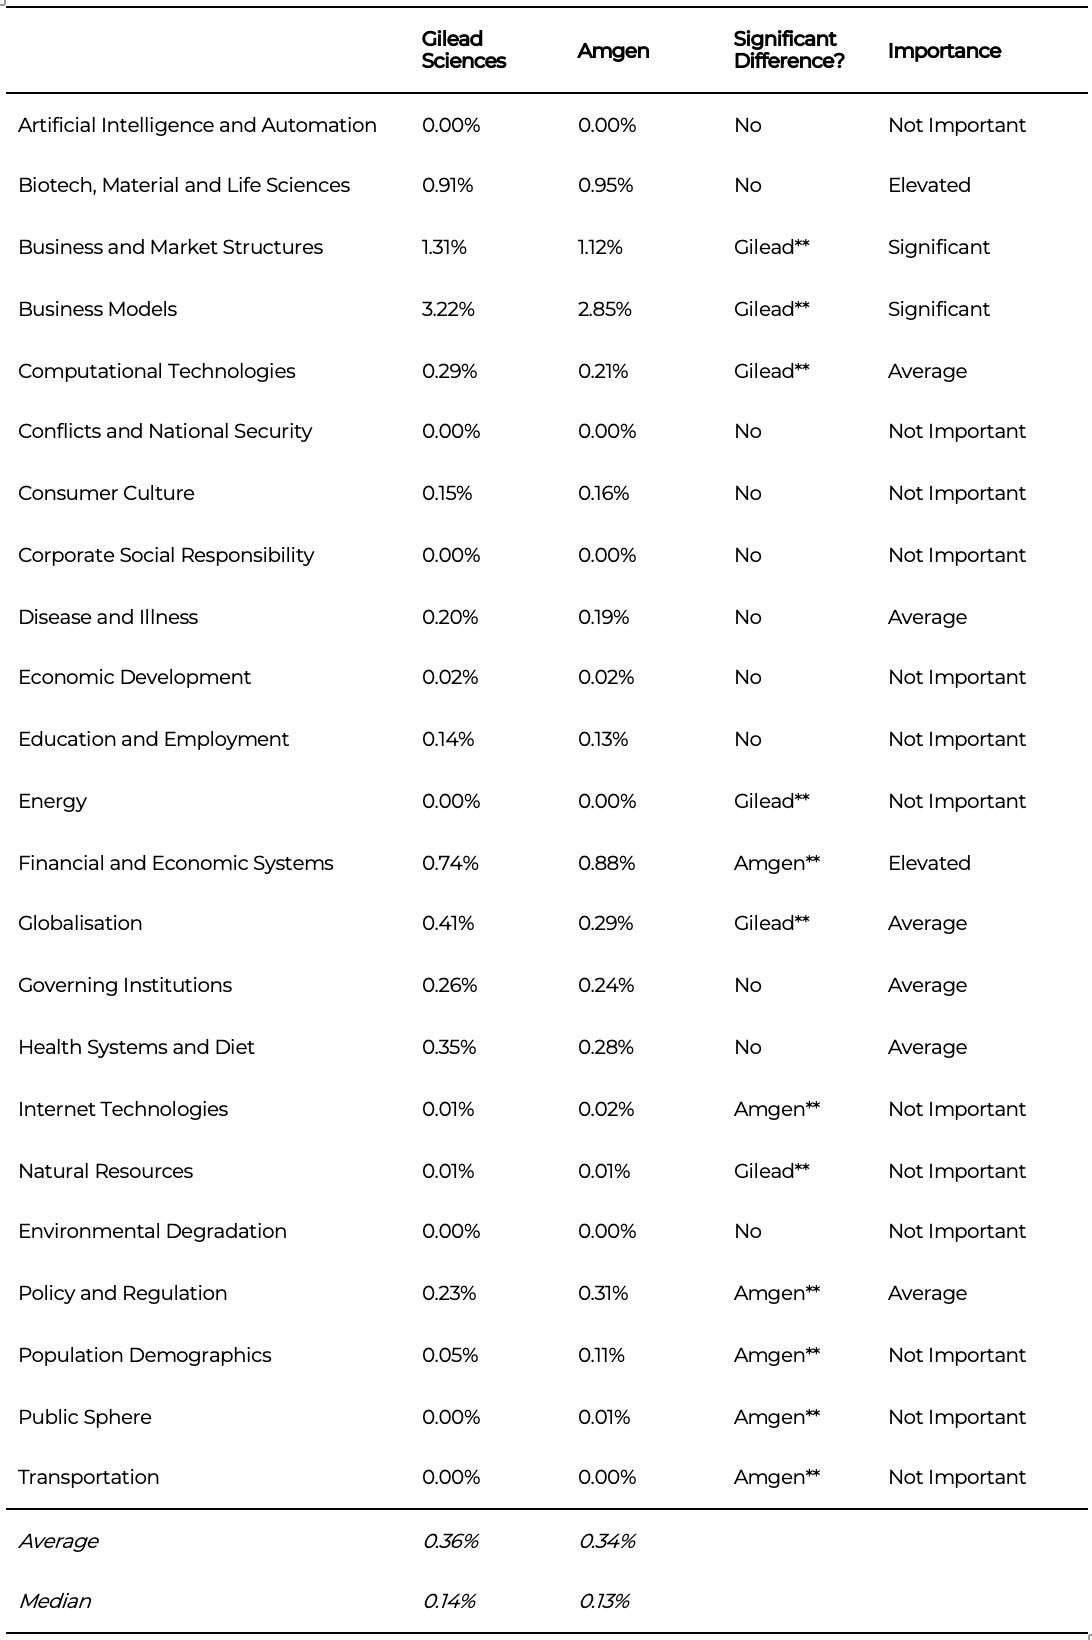
Significant difference measured using a t-test where * is a p-value lower than 0.05 and ** is a p-value lower than 0.01.
Across all three pairs
The cross-industry synthesis crystallised the findings. Of the 23 driver clusters, nine showed a statistically significant difference between the Superfirm and its competitor. Superfirms, on average, emphasised 3.3 driver clusters significantly more than their competitors. Their competitors emphasised 2.0.
But the decisive finding went beyond volume. When I plotted these results on the Growth-Impact Matrix, a clear pattern appeared: Superfirms consistently chose to emphasise driver clusters that scored higher — clusters with rapid growth trajectories and net positive impacts. Their competitors’ emphases tended to cluster around slower-growing or negatively-framed drivers.

I created a simple scoring system to quantify this. Growth is scored from +1 (baseline) to +4 (exponential). Impact is scored from -2 (threat) to +2 (opportunity). The effect of each driver cluster is the product of its growth score and its impact score.
When I summed the effects for each firm, the Superfirms scored an average effect of +6.7. Their competitors scored -0.3. The gap was enormous.
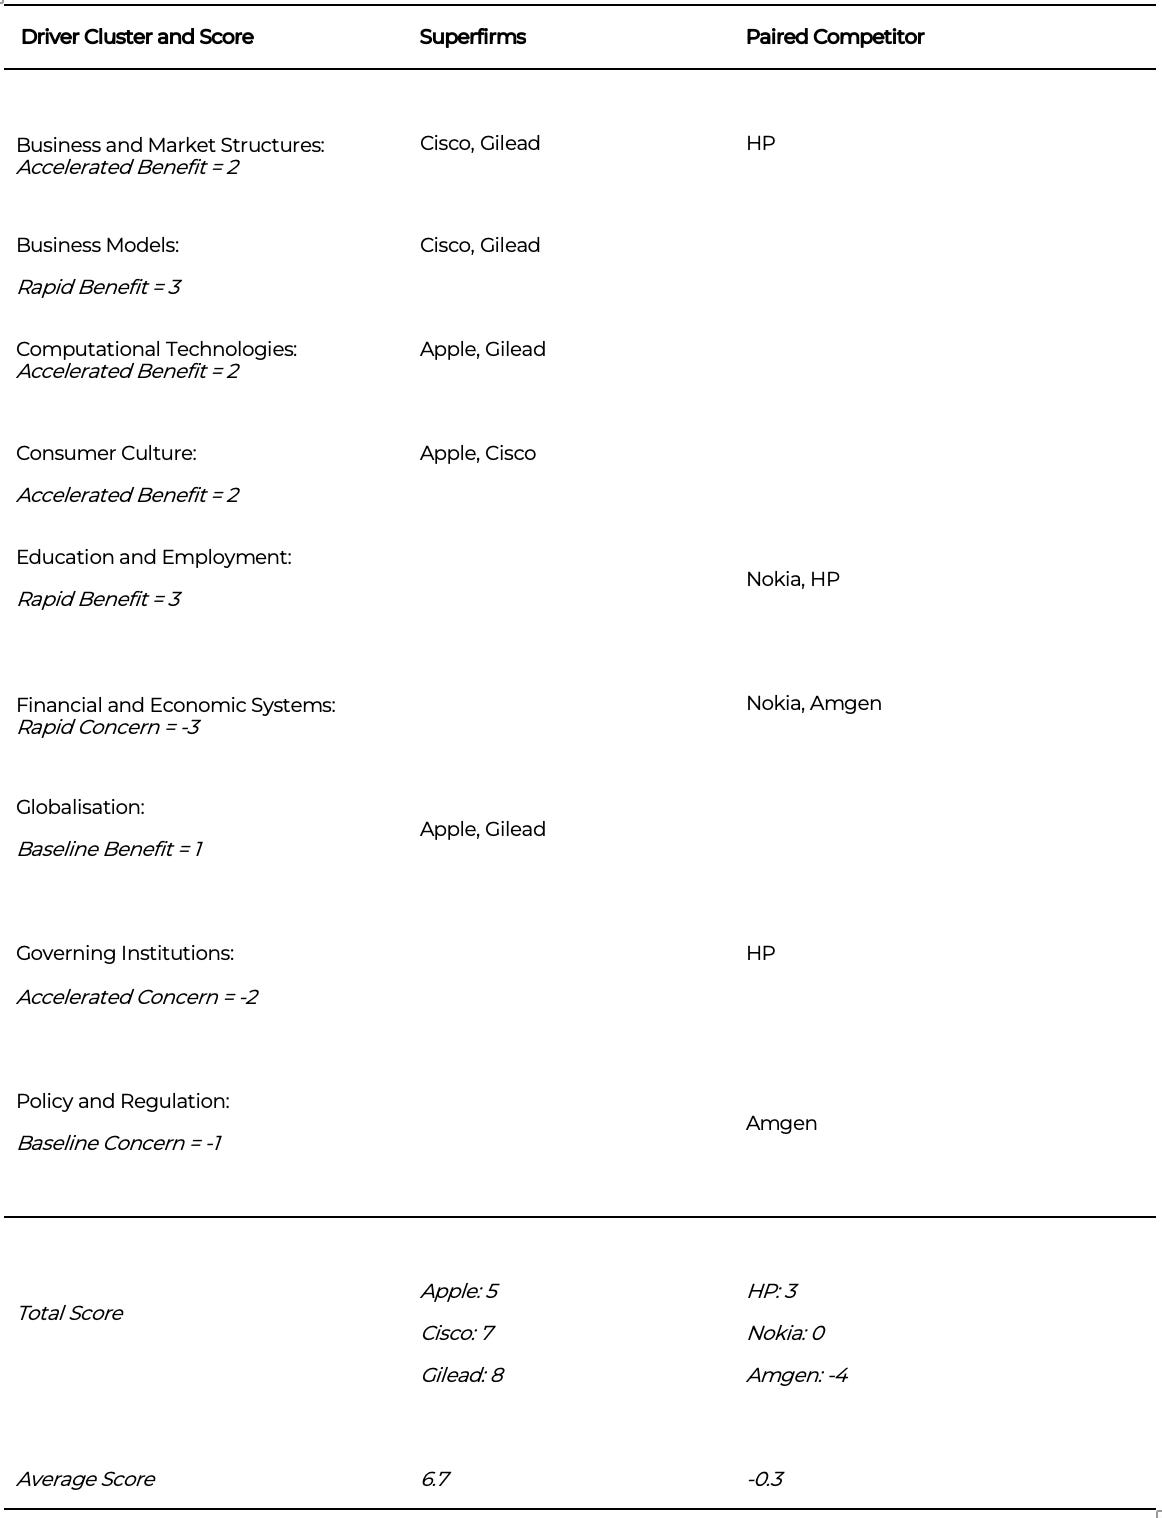
This is a key finding of the entire PhD. It’s not just that Superfirms talk more about external drivers. It’s that they talk about the right ones: the ones with high growth and positive impact. Their strategic narratives are oriented toward structural tailwinds. Their competitors’ narratives are oriented toward operational and financial housekeeping.
There was also a nuance worth noting. Some driver clusters were emphasised by multiple Superfirms — business models, for instance, was significant for both Cisco and Gilead. But the specific words driving the emphasis were different. Cisco discussed ‘products’ and ‘services’. Gilead discussed ‘patients’ and ‘treatments’. Same theme, unique manifestation. This would become a key element of the theory that emerged.
Thematic Strategy
The findings from the three research papers converged on a single idea. Market-dominant firms don’t just have better products or stronger brands. They make deliberate, sustained strategic choices to align with a small number of external drivers of transformation, and they do this more consistently and more emphatically than their competitors.
I called this idea Thematic Strategy.
Thematic Strategy proposes that a firm can find a path to market dominance by adopting a structured approach: identify a small number of long-term drivers of transformation from the external environment, select them as strategic themes, and make those themes the anchor for every subsequent decision the firm takes.
The concept is built on six propositions:
One: Strategic alignment with long-term drivers of transformation provides a path to market dominance. The research identified nearly 300 drivers of transformation. A theme is drawn from these. It is external to the firm, observable over time, and indicates a fundamental structural change, and not a fad or a trend.
Two: Themes must be observable over many years, indicate an underlying structural change, have cross-industry relevance, and lead to action. A theme must pass three tests. Is it observable and sustained? Does it indicate structural change? And does it prompt action from leadership?
Three: Selected themes are the starting point and anchor for all subsequent strategic and operational decisions a firm takes. Once chosen, a theme becomes the organising principle that shapes planning, investment, operations, and culture. It is not a side initiative. It is the centre of gravity.
Four: Multiple themes can be combined to create a distinct competitive advantage. The Superfirms typically emphasised three or four themes simultaneously. These themes can operate across different dimensions of the business and reinforce each other.
Five: The most significant competitive advantages reside with themes that have an expected high-growth future trajectory and a net positive impact. When a firm selects themes that are growing rapidly and that academic and market discourse frames positively, it positions itself along structural tailwinds. This is what the Growth-Impact Matrix captured.
Six: The specific manifestation of each theme can be unique to each firm, and this manifestation provides further opportunities for a distinct competitive advantage. Multiple firms can pursue the same overarching theme. But the way each converts it into products, processes, and operating models can be different. This embeds the theme within proprietary capabilities that competitors cannot easily replicate.
Thematic Strategy sits at the intersection of three established streams of strategic management. It extends strategic foresight by directing it toward a structured set of drivers, not just open-ended scanning. It extends the resource-based view by providing a guide for which resources to build. And it extends strategic positioning by showing how firms can anticipate and reshape industry boundaries rather than simply finding their place within them.
In practice, Thematic Strategy operates at the corporate level. Its primary mechanisms are exogenous drivers of transformation. Once selected, these themes provide the strategic logic that connects what the firm sees in the world, what it invests in, and where it competes. The themes are the through-line. Everything else follows from them.
What makes Thematic Strategy different from existing strategic frameworks is that it elevates the theme — a driver of transformation — as the central unit of analysis. Strategy research has traditionally separated position, resources, and capability into distinct conversations. By placing the theme at the centre, Thematic Strategy creates a common reference point that bridges all three. The theme tells you where to position, what resources to build, and which capabilities to develop.
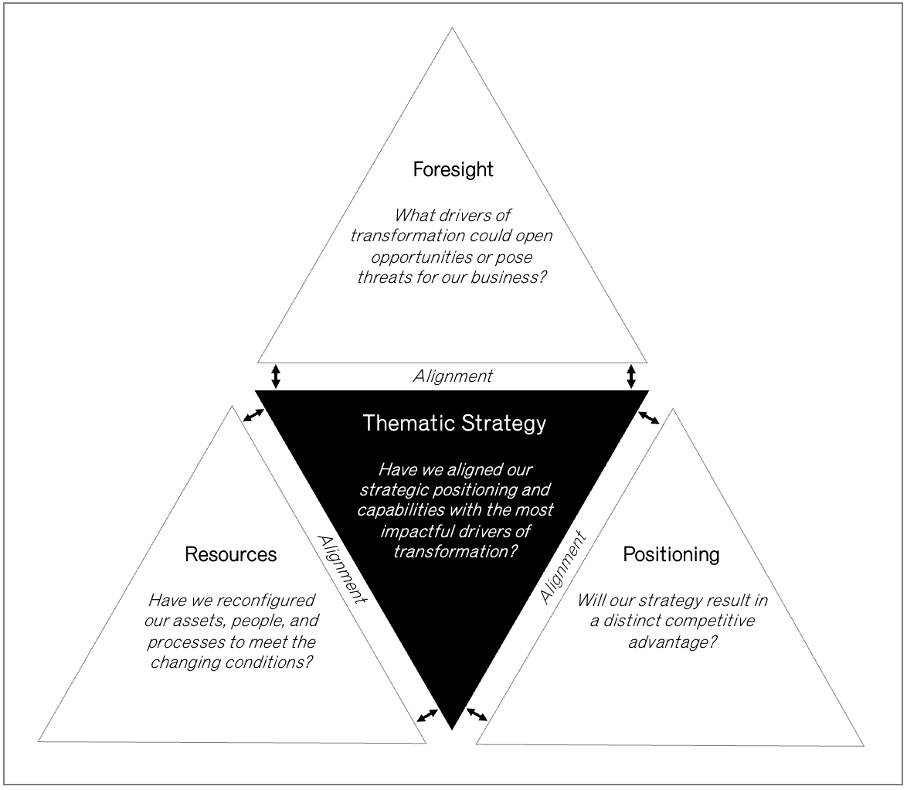
The core question Thematic Strategy poses to any leadership team is this:
Have we aligned our strategic positioning and capabilities with the most impactful drivers of transformation?
The evidence from this research suggests that the firms that can answer yes to that question, and sustain that answer over many years, are the ones that capture a dominant share of their industry’s profits.
What This Means
Most firms define strategy from the inside out. They start with what they have, their products, their people, their processes, and ask how to make it better. Thematic Strategy says start from the outside in. Look at the structural forces reshaping the world. Choose a small number. Make them yours.
The research showed that across technology, biotech, and telecommunications, the firms that dominated their industries’ profit pools did so by aligning early with a handful of high-growth, positive-impact drivers of transformation. They didn’t chase every trend. They didn’t spread their strategic attention thin. They picked their themes and made them the centre of everything.
Their competitors, facing the same external forces and operating in the same markets, oriented inward; toward financial structures, regulatory management, and operational mechanics. Those are necessary activities. But they are not what creates dominance.
For any executive reading this, the implications are practical. Identify the structural forces that will shape your industry over the next decade. Select three or four. Test them against the criteria: are they observable and sustained, do they indicate structural change, and do they demand action? Then make those themes the anchor for every investment, capability, and positioning decision your organisation takes.
Don’t try to respond to everything. The Superfirms didn’t. They chose a small number of themes and committed to them over many years. The discipline is in the selection and the sustained commitment, not in breadth of coverage.
In a world defined by these drivers of transformation, the firms that thrive will be those that align early, act decisively, and sustain that alignment over time.
That is Thematic Strategy. And the evidence suggests it works.